
Rates of Ribosomal RNA Evolution Are Uniquely Accelerated in Eukaryotes
Michael Syvanen
Department of Medical Microbiology and Immunology, School of Medicine, University of California, Davis, CA 95616, USA
Received: 8 February 2001; Accepted: 17 January 2002
AbstractA novel procedure for testing the relative rates of evolution is described. The procedure, the distance-matrix rate test, consists of creating a graph that displays two complete distance matrices for two different genes derived from the same group of species, an approach made practical by numerous whole genomic sequences. The results in this paper show that the molecular clock of ribosomal RNA from Eukaryotes is uniquely accelerated and highly variable while those of Archaea and Bacteria are not. This idiosyncratic eukaryotic rRNA evolution is not observed with four different protein genes. The distance matrix rate test consists of plotting the distance of one gene (from two different species) against the distance of a second gene (from the same pair of species) in the form of a simple X-Y plot. Because it is not possible to compute variances (or co-variances in this case) that can be meaningfully compared to expectations from a Poisson process, the test does not permit calculations of an index of dispersion. In place of this, equations are given for the 95% confidence limits expected for a Poisson process. The test was applied to the proteins rpsl1 and rp114, as one example, and to rps11 and ssu rRNA as a second example. In addition, the cytochrome c and cytochrome c oxidase evolution from a larger group of Eukaryotes are compared to each other and that of the ssu rRNA. This graphical test shows that the evolution of the four proteins and the archael and bacterial ssu rRNA's are consistent with a Poisson process since last common ancestor. The distance-matrix rate test that is introduced in this study needs to make no assumptions regarding evolutionary rates, divergence times, or phylogenetic relationships. Keywords: Ribosomal ssu rRNA, rps11, rp114, Distance-matrix, Stochastic clock, Longevity sensor Correspondence to: Michael Syvanen — Email: syvanen@ucdavis.edu |
Introduction
The idea that new mutations both arise and are fixed randomly and that the process can be modeled by the Poisson distribution is central to the neutral theory of evolution (Kimura 1983). Given that mutation rates appear roughly to be constant with time has resulted in the notion of a molecular clock. Careful application of the (Sarrich and Wilson 1967) relative rate test to numerous proteins provides support for this model though, to be sure, it is abundantly clear that some lineages have a measurably different molecular clocks than do others (Li 1993; Tajima 1993). However, the molecular clock hypothesis has never found support from ribosomal RNA sequences. It has been noted on numerous occasions that different lineages, especially among Eukaryotes, have highly different rRNA rates (Sogin and Gunderson 1987; Carmean et al. 1992; Nadler 1992; VandePeer et al. 1993; Kooistra and Medlin 1996; Simon et al. 1996; Carranza et al. 1997;Schmitz and Moritz 1998; Stevens et al. 1998; Otsuka et al. 1999; Garcia et al. 2000; Martin et al. 2000; Norman and Ashley 2000). Indeed, it has been suggested that accelerated rates of evolution of ssu RNA in some eukaryotic lineages have resulted in “long branch attraction” and caused artefactual assemblages (Stiller and Hall 1999; Morin 2000). The current paper describes a systematic investigation into the question of the rate of ssu rRNA evolution. In particular, a procedure is introduced that allows the rate of ssu RNA evolution to be compared directly to that of proteins within the same lineages.
Earlier studies that analyzed variance in distances were, in principle, statistically rigorous, but they relied on certain assumptions or other knowledge. For example, the assumption that the species under comparison diverged from one another at the same time [i.e., as a star phylogeny (Gillespie 1984; Ohta 1995)], or knowledge of phylogenetic relationships of the species under comparison (Langley and Fitch 1974), or the knowledge of divergence times based on geological dates were required in the analyses. An error in any of these estimates or failure of assumption will yield a variance that reflects the error, and does not reflect the underlying substitution process. In the current paper, I introduce a procedure that allows a direct test for the random nature of the substitution process that can be applied to lineages displaying different molecular clocks. This technique, called the distance-matrix rate test, does not require knowledge of either the absolute times of divergence between species being compared nor their phylogenetic relationships. This test is a graphical test and allows one to assess whether or not the distances vary in manner consistent with a random process. The distance-matrix rate test compares the evolution of one gene against a second both from the same group of organisms.
Methods
All computations were carried out using the set of programs provided by the Genetics Computer Group in Madison, WI. Initial multisequence alignments were carried out using Pileup and these were manually edited to improve matches. All sequences that fell within large indels were deleted. This operation was performed in order to keep distances between, say, two Eukaryotes comparable to distances between two bacteria. As an example, Eukaryotes have ssu rRNAs that are 2–3 hundred bases longer than those from Bacteria. After the multisequence alignment, this difference shows up as large gaps in the bacterial sequence. When distances are computed, these gapped regions are not counted when Bacteria are involved, but they are counted when a pair of Eukaryotes are scored. Since indel regions, for both rRNA and protein sequences, are usually less functionally conserved, counting them in the final distance matrix will result in faster apparent molecular clocks for closely related pairs than when compared to the more remotely related pairs. Single and double site indels were coded to represent a twenty-first amino acid or fifth base. Distances, Dij, for proteins were computed by counting the number of differences divided by the number of sites compared and corrected using the Kimura (1983) Protein distance method, while distances of the nucleotide sequences between rRNA gene were corrected assuming a gamma distribution of substitutions (Jin and Nei 1990). The program Treeview (Page 1996) was used to prepare the unrooted phylogenetic tree.
Distance-Matrix Rate Test
The 20 taxa used in this study are shown in Table 1. Sequences from three genes found in each species were examined: rps11 (102 positions), rp114 (124 positions), and ssu rRNA (702 positions, mostly from the 3′ half of the gene). The 190 pairwise distances (Dij values being the number of differences per 100 residues) for each of the three genes were imported into an Excel worksheet. The Dij values between the same two species for each pair of genes were plotted against each other in a simple X–Y scatter plot. A best straight line is found to fit the data and intersect x,y at zero. The straight line will take the form dy = kd x where d indicates the total number of pairwise differences (i.e., d = Dij × length/100) and x and y designate the two genes.
95% Confidence Levels
If molecular evolution is neutral and substitutions appear by a random
process such as radioactive decay, then the number of substitutions that have
occurred after the separation of two species is d with a standard deviation
equal to ![]() For values of d sufficiently large, the
95% confidence level is
For values of d sufficiently large, the
95% confidence level is ![]() Thus, we would expect that 95% of the distances
will lie within
Thus, we would expect that 95% of the distances
will lie within ![]() and
and ![]() of the line dy=
kdx. The shortest distance to the point that lies
exactly at the 95% confidence limit from the best straight line
dy= kdx will be
2(dy+ dy)1/2 (i.e., the
hypotenuse of the right triangle with sides
of the line dy=
kdx. The shortest distance to the point that lies
exactly at the 95% confidence limit from the best straight line
dy= kdx will be
2(dy+ dy)1/2 (i.e., the
hypotenuse of the right triangle with sides ![]() and
and ![]() Thus, the two curves defining the
95% confidence levels dy1 (above the line) and
dy2 (below the line) appear as
Thus, the two curves defining the
95% confidence levels dy1 (above the line) and
dy2 (below the line) appear as


These statements for dy1 and dy2 are used to determine the approximate 95% confidence curves shown in Fig. l and Fig. 4. Please note: d is the total number of substitutions counted and is not the same as Dij. In Fig. l and 4, dy1 and dy2 are calculated and then transformed to be consistent with the Dij values. In addition, dy1 and dy2 cannot be considered mathematically correct unless k is known with certainty. But because the variance in dy and dx are very much less than the variance in k, Equations 1 and 2 give very good approximations for the 95% confidence level.
Results
Evolution of Two Ribosomal Proteins
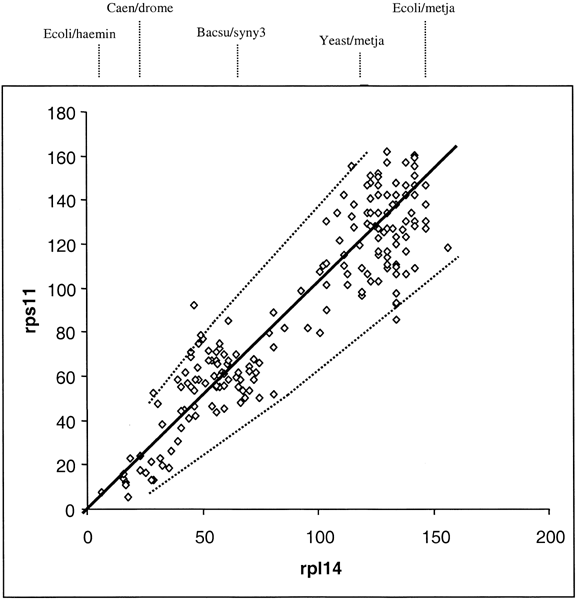
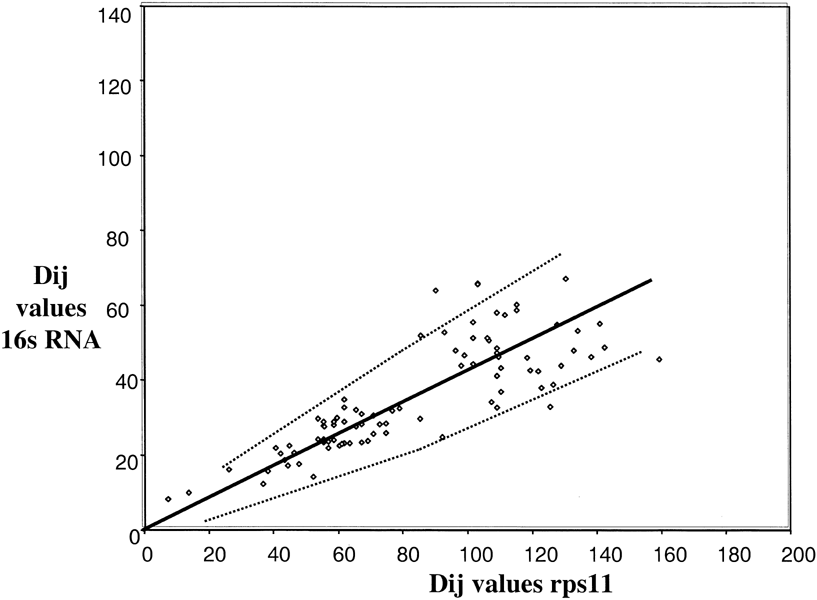
The sequence of ribosomal proteins rps11 and rp114 were obtained from the same 20 species shown in Table 1. These species have representatives from Eukaryotes, Archaea, and Bacteria. Dij values for rps11 and rp114 from the 190 comparisons from the same 20 species were determined. The total number of replacements responsible for the Dij value from rps11 for one pair of species was then plotted against the value from rp114 for the same pair of species. The data is shown in Fig 1. Each point in the graph represents four sequences—the distance between two rps11 sequences plotted against the distance between two rp114 sequences, sampled from the same two species.
The solid line in Fig. 1 is a best least squares fit of a straight line that intersects the origin. The dotted lines give the 95% confidence levels (i.e., 2 standard deviation) calculated assuming a random process of amino acid replacements (see Eqs. 1 and 2 as described in Methods). As can be seen, the data fit well within the 95% confidence levels. This result is consistent with a mode of evolution whereby amino acid replacements have occurred entirely by chance in the two proteins rps11 and rp114 since the diversification of life's three major kingdoms. This does not mean that the rate of evolution in the various lineages are necessarily the same. It does mean, however, that if the rate of change in rps11 is relatively slow in say an archael lineage, then it is comparably slow for rp114 in the same lineage. This result directly supports the hypothesis that the mutation frequency tempered by protein functional constraint in any given lineage determines the rate of divergence. Because the slope of the curve in Fig. 1 is about 10% less than one, we can also conclude that rps11 is about 10% less functionally constrained than is rp11411.
A note about the analysis of variation that is used with the distance-matrix rate test. Normally with N independent comparisons one could simply calculate the correlation coefficient and covariance in order to test whether the two variables are related by a time dependent stochastic process. This won't work here because the distance-matrix values are auto-correlated. That is, N independent sequences will yield N(N− l)/2 distances. Thus, any calculated covariance will be artificially low. Therefore, to assess whether or not the replacement process is random, the 95% confidence intervals are given. As we can see, all 190 points lie within those intervals; this does not mean that the variation is tighter than expected for a Poisson process. Because the 190 points arise from 20 independent objects, we would have an expectation of only 64% that at least one data point lies outside the 95% intervals. However, if one of the 20 comparisons was an outlier, then that would likely result in 20 points falling outside the 95% interval. In addition to this problem, there is the problem of shared histories. This is the same problem faced by the Sarrich and Wilson (1967) relative rate test, and it precludes that test from being used to judge the stochastic nature of the substitution process. Thus, a rigorous statistical test is not feasible here. But we can see that the divergence numbers shown in Fig. 1 are consistent with a stochastic process.
We may conclude from the data in Fig.1 that the evolution of rps11 and rp114 can be accounted for entirely by the neutral theory of evolution. Note: we did not need to consider 1) time of divergence between species being compared, 2) their phylogenetic relationships, nor 3) assume a constant molecular clock.
Evolution of ssu Ribosomal RNA
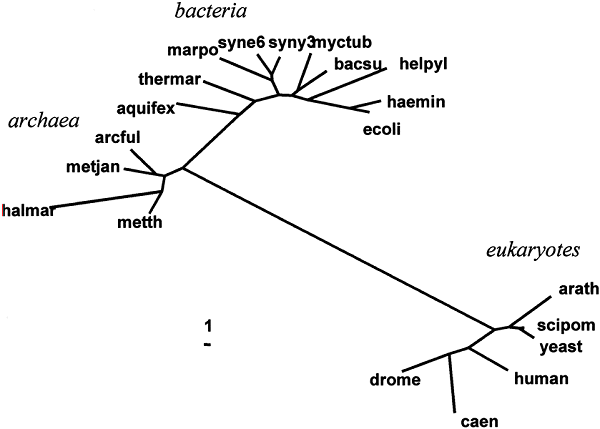
As mentioned, the small subunit of ribosomal RNA (ssu rRNA) maintains a notoriously non-constant rate of evolution. This fact is most apparent if we simply examine a distance tree for the 20 species (see Fig. 2). This tree computed from the ssu rRNA distances using the neighbor-joining method of Saitou and Nei (1987) and Studier and Keppler (1988)— a distance algorithm that does not assume rate constancy. If the tree is rooted on the branch leading to Bacteria, we can see that the eukaryotic branch is much longer than the others. If we compare the present result with ssu rRNA trees published previously (see Pace 1997), it will be noted that the relative lengths of internal branches are much longer than those of terminal branches. This difference in relative branch lengths is possibly due to differences in multisequence alignment.
By applying the distance-matrix rate test to ssu rRNA and the ribosomal protein shown in Fig 1, we can gain insight into the question: Is the accelerated rate of eukaryotic evolution seen for ssu rRNA also seen for the proteins? Or is there something unique about ssu rRNA evolution?
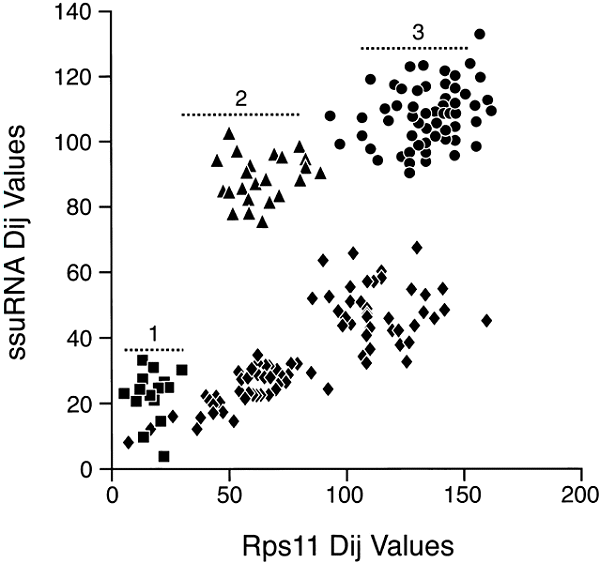
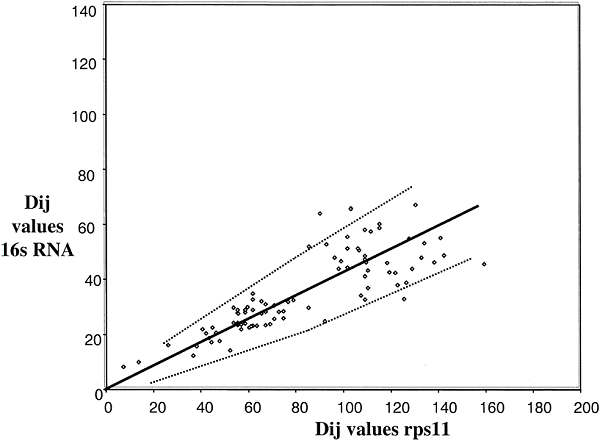
A comparison of ssu rRNA with rps11 is shown in Fig 3. Simple examination shows a very complex pattern that is in no way linear, at least with a variation consistent with a random process. The points do, however, fall into different clusters that can be interpreted. To simplify, in Fig. 4, the comparisons among only the Bacteria and Archaea are shown. In this case, the points do lie on a straight line with most of them inside the 95% confidence levels predicted for a random process. Thus, we can conclude that the rates of evolution of ssu rRNA evolution among the Bacteria and Archaea are comparable to those of rps11 (corrected, of course, for different levels of functional constraint). The remainder of the data that includes comparisons involving Eukaryotes falls then into three major clusters, as indicated in Fig 3. Cluster 1 (squares) contains the Eukaryotic/Eukaryotic comparison, cluster 2 (triangles) contains the Eukaryotic/Archaea comparison, and cluster 3 (circles) contains the Eukaryotic/Bacteria comparison. The results show that Eukaryotic ssu rRNA evolution is both faster and more variable that those from Archaea and Bacteria.
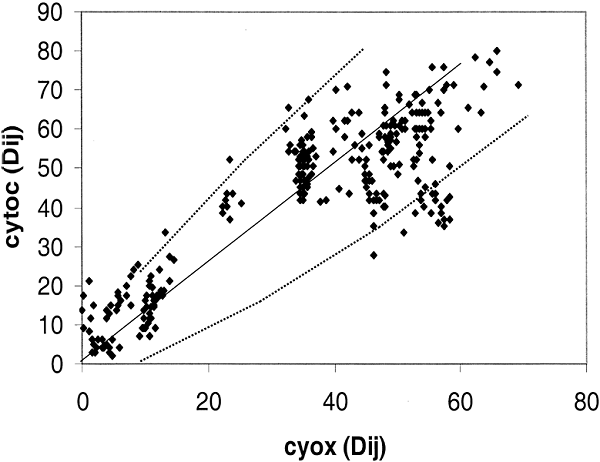
The variability in rRNA evolution does not apply to proteins in Eukaryotes. To confirm this result with a larger group of Eukaryotic taxa, 25 species were chosen whereby we could perform the distance-matrix rate test with cytochrome c, and cytochrome c oxidase, and also cytochrome c oxidase and ssu rRNA. The comparison between the two proteins is shown in Fig. 5. Again we see that when the two proteins are compared, deviation from the norm is close to expected for a random process. From 25 different sequences there is a 72% chance that at least one will have a number of changes that lies outside of the 95% confidence level. There is, in fact, one sequence that falls outside the 95% expectation level that is influencing the pattern in Fig. 5 as is apparent from the 15 points lying below the line dy2 between 40 and 60 on the y axis.
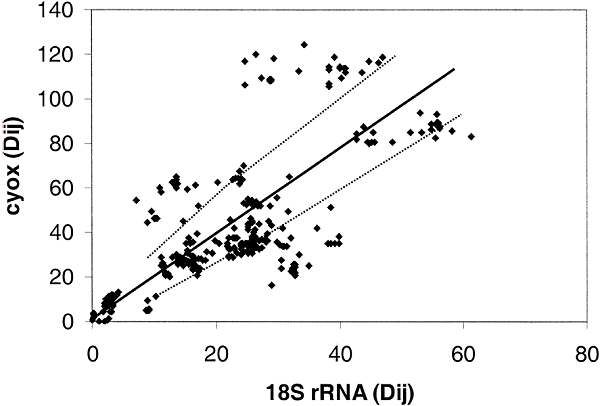
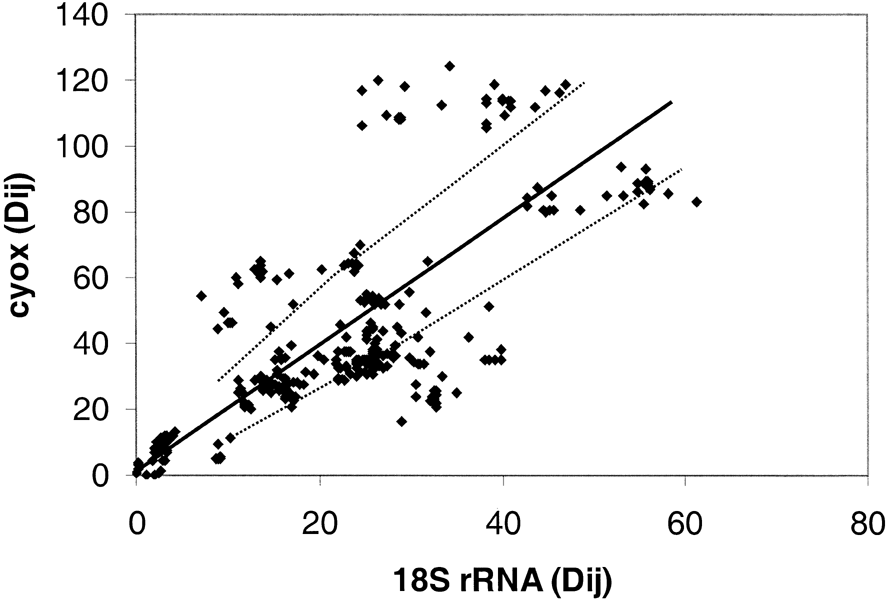
Figure 6 shows the comparison between 18S ribosomal RNA and cytochrome c oxidase. As can be seen, there is extensive deviation with about one-third of the points lying beyond the 95% expectation level. Figure 5 shows that the rate of evolution of the two proteins is comparable, thus we can again conclude that it is the ssu rRNA whose rate is highly variable.
Discussion
Results from the distance-matrix rate test shed light on the peculiarities in the rate of ssu rRNA evolution. The data in this paper shows clearly that it is the ssu rRNA substitution rate in the Eukaryotes that is different from expectation, and, for the most part, greatly accelerated over that of the Archaea and Bacteria. This accelerated rate is restricted to the genes for rRNA and is not genome-wide. From Fig. 2 it is clear that the rate of evolution of ssu rRNA in the line leading to the common ancestor of modern eukaryotes is greatly accelerated. The results from the comparison of the 25 eukaryotic proteins shows that this accelerated rate continued beyond the eukaryotic radiation and that, furthermore, this rate is highly variable among the different eukaryotes. According to neutral theory, the rate of evolution is equal to mutation frequency times a correction for functional constraint. The fact that the distance-matrix test is linear for rps11, rp114, rps11, and ssu RNA for the Archaea and Bacteria, and for the eukaryotic cytochrome c and cytochrome c oxidase, is totally consistent with the notion that the degree of functional constraint acting on each macro-molecule is the same in the different lineages, and further, that the genome-wide mutation frequency acting on each of these five genes is identical in the same species (though, as mentioned before, they could differ between different species). Furthermore, this paper shows that the evolutionary process that controls the substitution process in the ribosomal proteins rps11, rp114, the Archael/Bacterial ssu rRNA, and the cytochrome c and cytochrome c oxidase is largely a random process. The very large variances (Ohta and Kimura 1971; Gillespie 1984; Ohta l995; Iwasa 1993; Takhata 1991; Nielsen 1997) that characterized earlier examinations [but not all (Zeng et al.1998)] into the stochastic nature of the molecular clock is most likely caused by differences in evolutionary rates in different lineages, by uncertainties in divergence times estimated from the geological record, or, in some cases, uncertainties in phylogenetic relationships. No assumptions about these three conditions are needed with the distance-matrix rate test in order to conclude the stochastic nature of the molecular clock.
These results mean the rate of evolution that is observed for the eukaryotic ssu rRNA genes is uniquely accelerated compared to eukaryotic proteins. A uniquely accelerated rate of ssu rRNA evolution can be seen to arise from one of two causes. One, the mutation frequency acting on the eukaryotic ssu rRNA genes is increased relative to that acting on the rest of the genome, or, two, functional constraint acting on ssu rRNA is less in Eukaryotes than it is in Bacteria and Archaea, There is insufficient information to rigorously decide between these two possibilities, but we would expect that if the rRNA is less functionally constrained in one group, then ribosomal proteins would also be less functionally constrained. There is no evidence for this in Fig. 3. In addition, relaxed functional constraint would cause the rate to accelerate, not increase the variability that is shown in Fig. 3 and 5.
However, there is one function that Eukaryote rRNA genes possibly performs that is not found in either Bacteria or Archaea. It is beginning to appear that, in Eukaryotes, a longevity sensor resides in the ribosomal RNA genes (Sinclair and Guarente 1997). The sensor is at the level of DNA, not RNA, thus it is a mechanism that probably doesn't affect functional constraint of rRNA. It has been found, in yeast, that genetic instability of the ribosomal DNA array is directly related to aging (Defossez et al. 1998). This genetic instability is controlled at the level of homologous DNA recombination. Furthermore, DNA repair genes that have homologs in other Eukaryotes influence this process and may possibly be genes that influence aging in these other systems (Park et al. 1999). If Eukaryotes have special error-prone recombination activities that are specific for the ribosomal DNA arrays, it would not be totally unexpected that such a system could influence germ line mutation rates. If so, this would provide an explanation for why ssu RNA could have uniquely variable mutation frequencies in Eukaryotes.
The data in Fig. 3 and Fig. 4 can also be construed as supporting the hypothesis that the ssu rRNA tree (also know as the “Universal Tree”) is rooted in the Bacterial branch. Figure 4 shows that rate of ssu rRNA evolution of the Bacteria and Archaea are not quantitatively different from their ribosomal proteins. Figure 3 shows quite clearly that the Eukaryotes are more closely related to the Archaea than they are to Bacteria (compare cluster 2 to cluster 3), a closer affinity that cannot find support in any differences in the rates of evolution between Archaea and Bacteria.
References
1. Carmean D, Kimsey LS, Berbee ML (1992) 18S rDNA sequences and the holometabolous insects. Mol Phylog Evol 1:270-278 [PubMed]
2. Carranza S, Baguna I, Riutort M (l997) Are the Platyhelminthes a monophyletic primitive group? An assessment using 18S rDNA sequences. Mol Biol Evol 5:485-497 [PubMed]
3. Defossez PA, Park PU, Guarente L (1998) Vicious circles: a mechanism for yeast aging. Curr Opin Microbiol 1:707-711 [PubMed]
4. Garcia-Varela M, Perez-Ponce de Leon G, de la Torre P, Cummings MP, Sarma SS, Laclette JP (2000) Phylogenetic relationships of Acanthocephala based on analysis of 18S ribosomal RNA gene sequences. J Mol Evol 6:532-540 [PubMed]
5. Gillespie JH (1984) The molecular clock may be an episodic clock. Proc Natl Acad Sci USA 81:8009-8013 [PubMed]
6. Iwasa Y (1993) Over dispersed molecular evolution in constant environments. J Theor Biol 164:373-393 [PubMed]
7. Jin L, Nei M (1990) Limitations of the evolutionary parsimony method of phylogenetic analysis. Mol Biol Evol 7:82-102 [PubMed]
8. Kimura M (1983) The neutral theory of molecular evolution. Cambridge University Press, Cambridge
9. Kooistra WH, Medlin LK (l996) Evolution of the diatoms (Bacillariophyta). IV. A reconstruction of their age from small subunit rRNA coding regions and the fossil record. Mol Phylog Evol 6:391-407 [PubMed]
10. Langley CH, Fitch WM (l974) An examination of the constancy of the rate of molecular evolution. J Mol Evol 3:161-177 [PubMed]
11. Li WH (l993) So, what about the molecular clock hypothesis? Curr Opin Gene 3:896-901 [PubMed]
12. Martin P, Kaygorodova I, Sherbakov DY, Verheyen E (2000) Rapidly evolving lineages impede the resolution of phylogenetic relationships among Clitellata (Annelida). Mol Phylog Evol 15:355-368 [PubMed]
13. Morin L (2000) Long branch attraction effects and the status of “basal eukaryotes”: phylogeny and structural analysis of the ribosomal RNA gene cluster of the free-living diplomonad Trepomonas agilis. J Euk Microbiol 47:167-177 [PubMed]
14. Nadler SA (1992) Phylogeny of some ascaridoid nematodes, inferred from comparison of 18S and 28S rRNA sequences. Mol Biol Evol 9:932-944 [PubMed]
15. Nielsen R (l997) Robustness of the estimator of the index of dispersion for DNA sequences. Mol Phylog Evol 7:346-351 [PubMed]
16. Norman JE, Ashley MV (2000) Phylogenetics of Perissodactyla and tests of the molecular clock. J, Mol Evol 50:11-21 [PubMed]
17. Ohta T (l995) Synonymous and nonsynonymous substitutions in mammalian genes and the nearly neutral theory. J Mol Evol 40:56-63 [PubMed]
18. Ohta T, Kimura M (1971) Behavior of neutral mutants influenced by associated over dominant loci in finite populations. Genetics 69:247-260 [PubMed]
19. Otsuka J, Terai G, Nakano T (l999) Phylogeny of organisms investigated by the base-pair changes in the stem regions of small and large ribosomal subunit RNAs. J Mol Evol 48:218-235 [PubMed]
20. Pace NR (1997) A molecular view of microbial diversity and the biosphere. Science 76:734-740 [PubMed]
21. Page RD (1996) Treeview: An application to display phylogenetic trees on personal computers. Comput Appl Biosci 12:357-358 [PubMed]
22. Park PU, Defossez PA, Guarente L (1999) Effects of mutations in DNA repair genes on formation of ribosomal DNA circles and life span in Saccharomyces cerevisiae. Mol Biol 19:3848-3856 [PubMed]
23. Sarich VM, Wilson AC (1967) Immunological time scale for hominid evolution. Science 158:1200-1203 [PubMed]
24. Saitou N, Nei M (1987) The neighbor-joining method: a new method for reconstructing phylogenetic trees. Mol Biol Evol 4:406-425 [PubMed]
25. Schmitz J, Moritz RFA (1998) Sociality and the rate of rDNA sequence evolution in wasps (Vespidae) and honeybees (Apis). J Mol Evol 47:606-6l2 [PubMed]
26. Simon C, Nigro L, Sullivan J, Holsinger K, Martin A, Grapputo A, Franke A, McIntosh C (l996) Large differences in substitutional pattern and evolutionary rate of 12S ribosomal RNA genes. Mol Biol Evol 13:923-932 [PubMed]
27. Sinclair DA, Guarente L (1997) Extrachromosomal rDNA circles—a cause of aging in yeast. Cell 91:1033-1042 [PubMed]
28. Sogin ML, Gunderson JH (1987) Structural diversity of eukaryotic small subunit ribosomal RNAs. Evolutionary implications. Anal NY Acad Sci 503:125-139 [PubMed]
29. Stevens J, Noyes H, Gibson W (1998) The evolution of trypanosomes infecting humans and primates. Mem Inst Oswaldo Cruz 93:669-676 [PubMed]
30. Stiller JW, Hall BD (1999) Long-branch attraction and the rDNA model of early eukaryotic evolution. Mol Biol Evol 16:1270-1279 [PubMed]
31. Studier JA, Keppler KJ (1988) A note on the neighbor-joining algorithm of Saitou and Nei. Mol Biol Evol 5:729-731 [PubMed]
32. Tajima F (l993) Simple methods for testing the molecular evolutionary clock hypothesis. Genetics l35:599-607 [PubMed]
33. Takahata N (1995) Statistical models of the over dispersed molecular clock. Theor Popul Biol 39:329-344 [PubMed]
34. Van de Peer Y, Neefs JM, De Rijk P, De Wachter R (l993) Reconstructing evolution from eukaryotic small-ribosomal-subunit RNA sequences: calibration of the molecular clock. J Mol Evol 37:221-232 [PubMed]
35. Zeng LW, Comeron JM, Chen B, Kreitman M (l998) The molecular clock revisited: the rate of synonymous vs. replacement change in Drosophila. Genetica 102–103:369-382 [PubMed]
Tables
Table 1. List of species for which completed sequences for the proteins rps11 and rp114 and ssu rRNA are available that were used in Figs. 1, 2, 3 4 and their abbreviations
Figures
 Figure
1
Figure
1
Figure
1 (large scale)
Fig. 1. Distance-matrix rate test plot between
two ribosomal proteins. The straight line is dy =
kdx and the dotted lines outline the 95% confidence levels
(seeMaterials and Methods for details of computation). The numbers
dx and dy are the total number of
replacements estimated to have occurred to produce a Dij value.
Representative rp114 D values for select pairs of species are shown above
the line (see Table
1 for key to abbreviations).
 Figure
2
Figure
2
Figure
2 (large scale)
Fig. 2. Distance tree based on ssu rRNA
sequences.
 Figure
3
Figure
3
Figure
3 (large scale)
Fig. 3. Distance-matrix rate test plot with
ssu rRNA, versus a ribosomal protein. Squares represent Eukaryote/Eukaryote
comparisons, triangles the Eukaryote/Archaea comparisons, circles the
Eukaryote/Bacteria comparisons, and diamonds the comparisons among Bacteria and
Archaea.
 Figure
4
Figure
4
Figure
4 (large scale)
Fig. 4. Distance-matrix rate test plot with
ssu rRNA excluding Eukaryotes. The best fit curve (solid line) and 95%
confidence intervals (dotted lines) are shown. The length of the ssu rRNA
sequencewas about 240 and that of rp114 was 110; the Slope used to calculate the
error curves (see Eqs. l and 2 in Methods) is k = 2.8.
 Figure
5
Figure
5
Figure
5 (large scale)
Fig. 5. Distance-matrix test comparing two
eukaryotic proteins: Cytochrome c (cytoc) with cytochrome c oxidase (Cyox). The
25 eukaryotic species that are compared are: Arabidopsis thaliana,
Ascaris suum, Caenorhabditis elegans, Canis familiaris,
Chlamydomonas reinhardtii, Cyprinus carpio, Drosophila
melanogaster, Emericella nidulans, Equus burchelli, Gallus
gallus, Hippopotamus amphibius, Homo sapiens, Kluyveromyces
lactis, Mus musculus, Neurospora crassa, Oryctolagus
cuniculus, Oryza sativa, Ovis aries, Rattus
norvegicus, Saccharomyces cerevisiae, Schizosaccharomyces
pombe, Squalus sucklii, Struthio camelus, Triticum
aestivum, Zea mays.
 Figure
6
Figure
6
Figure
6 (large scale)
Fig. 6. Distance-matrix test comparing 18S
rRNA and cytochrome c oxidase from Eukaryotes. The 26 eukaryotic taxa that are
compared are: Anopheles gambiae, Arabidopsis thaliana, Artemia
sanfranciscana, Asterina pectinifera, Chlamydomonas
reinhardtiit, Emericella nidulans, Gallus gallus, Latimeria
chalumnae, Lumbricus terrestris, Marchantia polymorpha,
Metridium senile, Mus musculus, Oryza sativa, Paramecium
tetraurelia, Pecten maximus, Pisum sativum, Plasmodium
berghei, Rattus norvegicus, Rhea americana, Rhipicephalus
sanguineus, Squalus acanthias, Strongylocentrotus
purpuratu, Struthio camelus, Triticum aestivum, Xenopus
laevis, Zea mays.